Applied Back of the napkin Likelihood of Exploitation Model
Overview
As users, we want to know which CVEs we need to remediate first based on our available resources/capacity to remediate them.
To develop an understanding of Risk Based Prioritization, we'll build a back of the napkin Risk Based Prioritization model that focuses on Likelihood of Exploitation.
We'll look at the tradeoff between Likelihood of Exploitation vs how many CVEs we need to fix.
When we look at Risk Based Prioritization models in products and production later in this guide; you'll be able to recognize many of the elements in our back of the napkin model
Back of the napkin Model
For this back of the napkin model:
- We use Threat Likelihood of Exploitation per our Risk Taxonomy
-
For this back of the napkin model, let's assume that
-
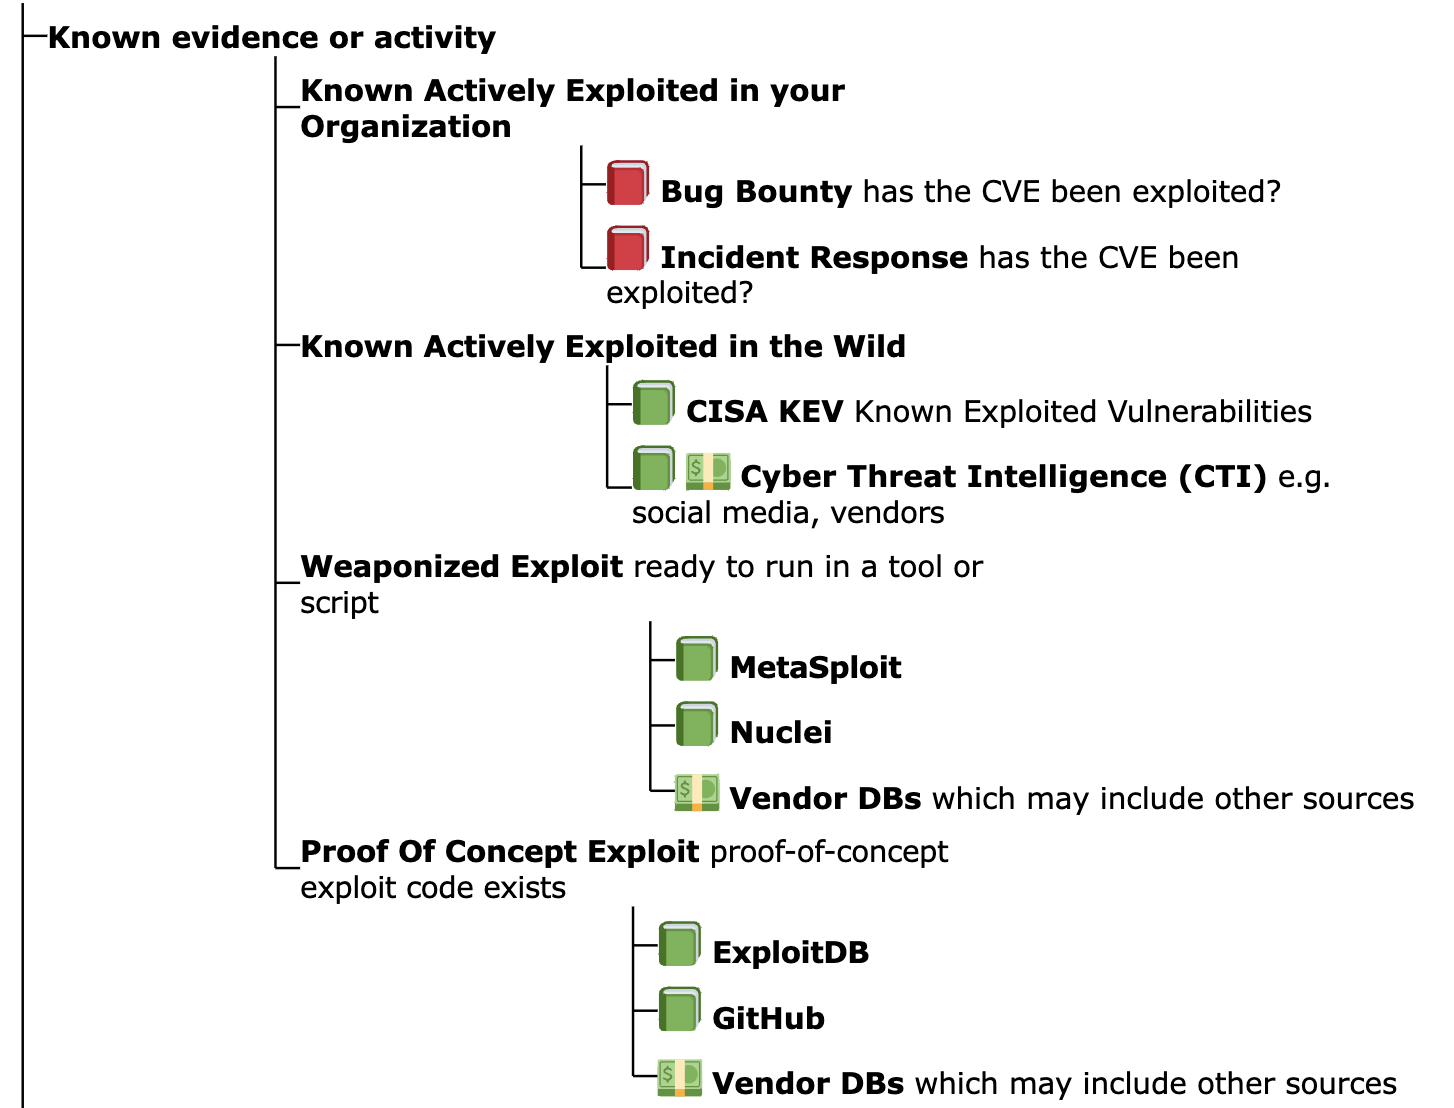
The odds of a vulnerability being exploited are in the order in the diagram (highest risk on top):
-
The probabilities quoted in section "Threat Likelihood of Exploit" are correct (though exact figures don't matter on this back of the napkin - the point is there's a significant difference)
- 37.1% it the vulnerability is weaponized
- 3.7% if a Proof Of Concept exists
- For counts of CVEs
- the counts of CVEs are per "Likelihood of Exploitation Populations" diagram
- there's a relatively small number of vulnerabilities that have been Known Exploited in our organization i.e. 10 or less
- We're looking at all published CVEs.
- You could apply this back of the napkin model to the subset of CVEs in your environment.
- We'll use a very exaggerated figure of ~~20K for CVEs that
have weaponized exploits or evidence of exploitation in the
wild (as it's a back of the napkin exercise and we want to
understand if our model is still useful in a well beyond
worst case scenario):
- So that gives ~~10% of CVEs that have weaponized exploits or evidence of exploitation in the wild
- In contrast, Qualys give a much smaller figure, “Less than 3% of vulnerabilities have weaponized exploits or evidence of exploitation in the wild, two attributes posing the highest risk”
-
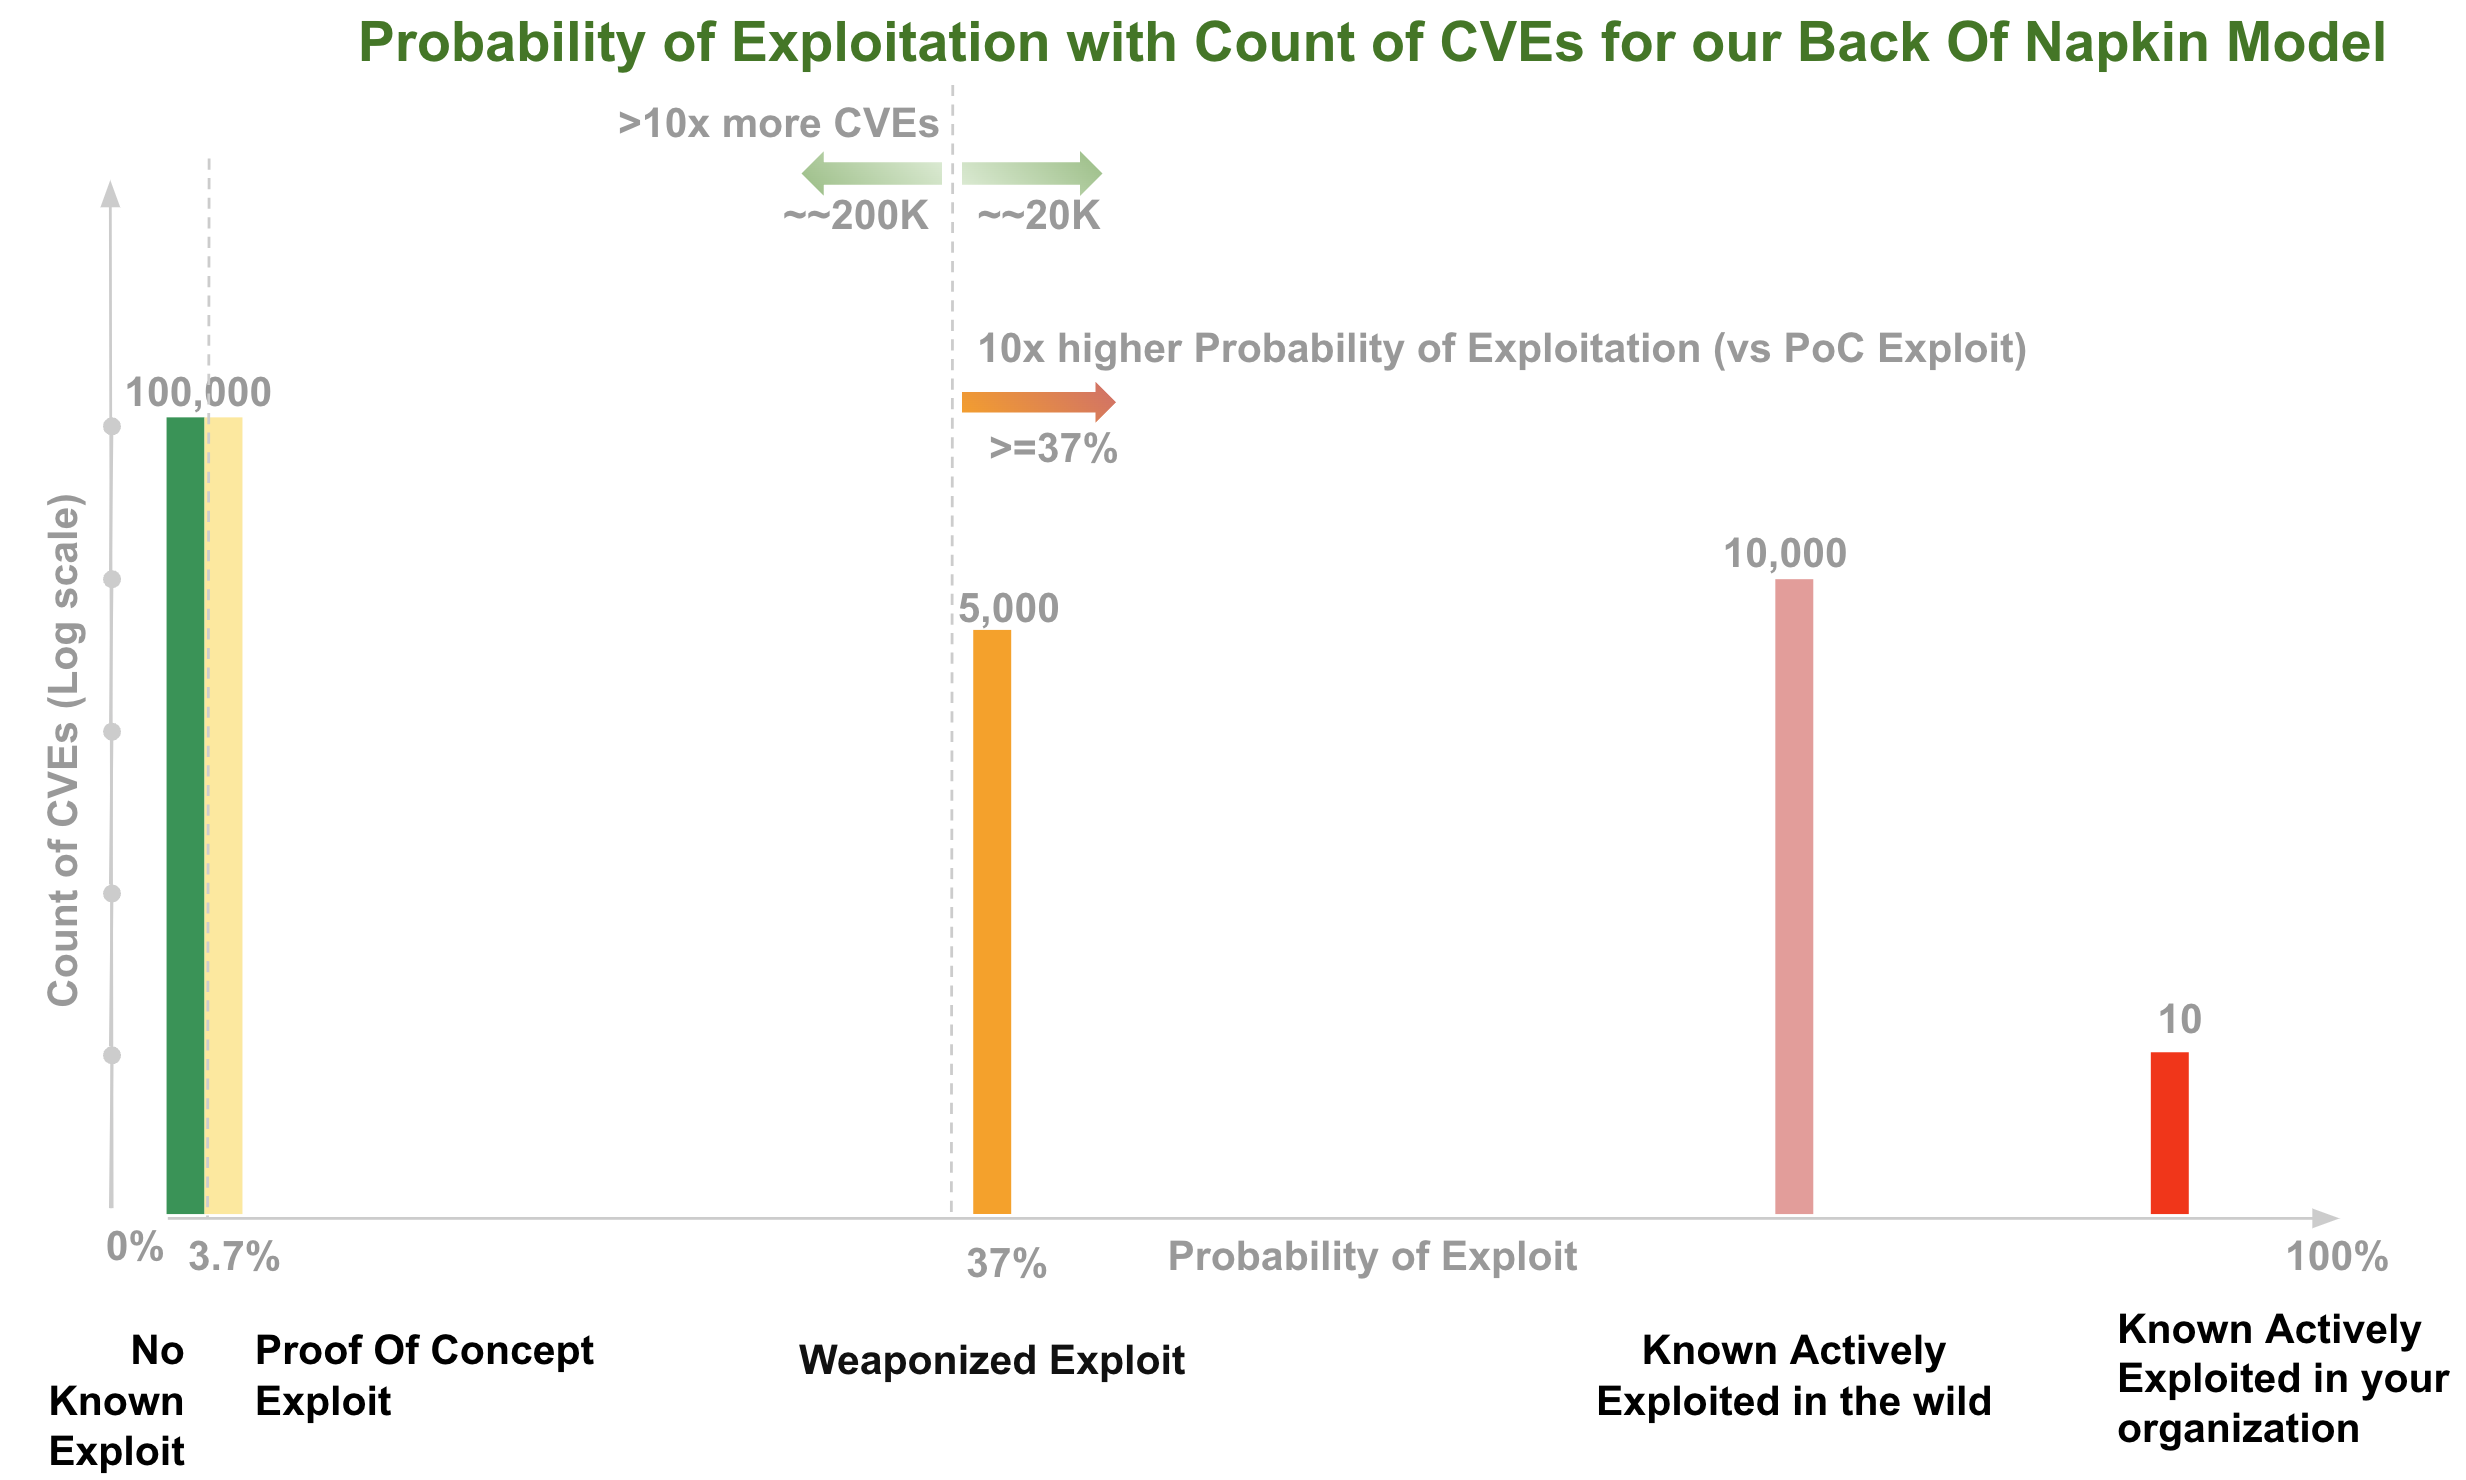
A rough drawing on the back of our napkin of Probability of Exploitation vs the Count of CVEs:
Observations
For this back of the napkin model:
- Using the Weaponized Exploit Probability of Exploitation (37%) as a
threshold gives two "10x's" i.e. at this threshold there's
- 10x higher probability of exploitation or greater
- there's 10% of CVEs (or >10x more CVEs are below this threshold)
- we can see that as we raise the threshold for Probability of Exploit, we have less CVEs to fix, (but we may miss some CVEs that we should have fixed).
For our organization risk posture, maybe we want to use the lower Probability of Exploitation Threshold associated with a Proof Of Concept exploit being available (3.7%).
- In this case, there's ~~100K CVEs below this threshold in the back of napkin model, and ~~120K above it (to remediate based on our threshold). So we remediate a lot more CVEs (and a lot more than the ~~5% that are exploited), but we miss a lot less of the ones we should have fixed).
Probability of Exploitation and associated population counts informs Remediation
Having these Probability of Exploitation values vs associated count of CVEs allows us make an informed decision based on our
- risk posture - using Likelihood of Exploitation
- resources/capacity available to remediate CVEs
Back of the napkin Model Remediation Policy
Per our Risk Remediation Taxonomy, Likelihood of Exploitation informs one part of Risk per Vulnerability.
To complete our back of the napkin Model for Prioritization we can use e.g. CVSS also.
So our Remediation Policy (for our first pass triage) could be:
- for all CVEs that are at Weaponized Exploitation and above in our
Likelihood of Exploitation diagram (~~10% using our beyond worst
case figure)
- remediate all CVEs that have a High or Critical CVSS score (~~65%)
This would require fixing 6.5% of CVEs (10% x 65%).
Takeaways
With this very simple back of the napkin model, and very exaggerated counts of weaponized exploitation, we see that by using Likelihood of Exploitation, we need to remediate 1/10 of CVEs versus using CVSS Base Score alone!!!