Likelihood of Exploitation Populations
Overview
Our ability to remediate depends on
- the priority (risk) of CVEs - the ones we want to remediate based on our security posture
- In the Understanding Risk chapter, we saw the ordered Likelihood of Exploitation for different populations of CVEs in the Risk Remediation Taxonomy.
- the number of CVEs for that priority (risk) - that we have the capacity/resources to fix
This section gives a
- view of the sizes of those populations
- the data sources for those populations
Population Sizes
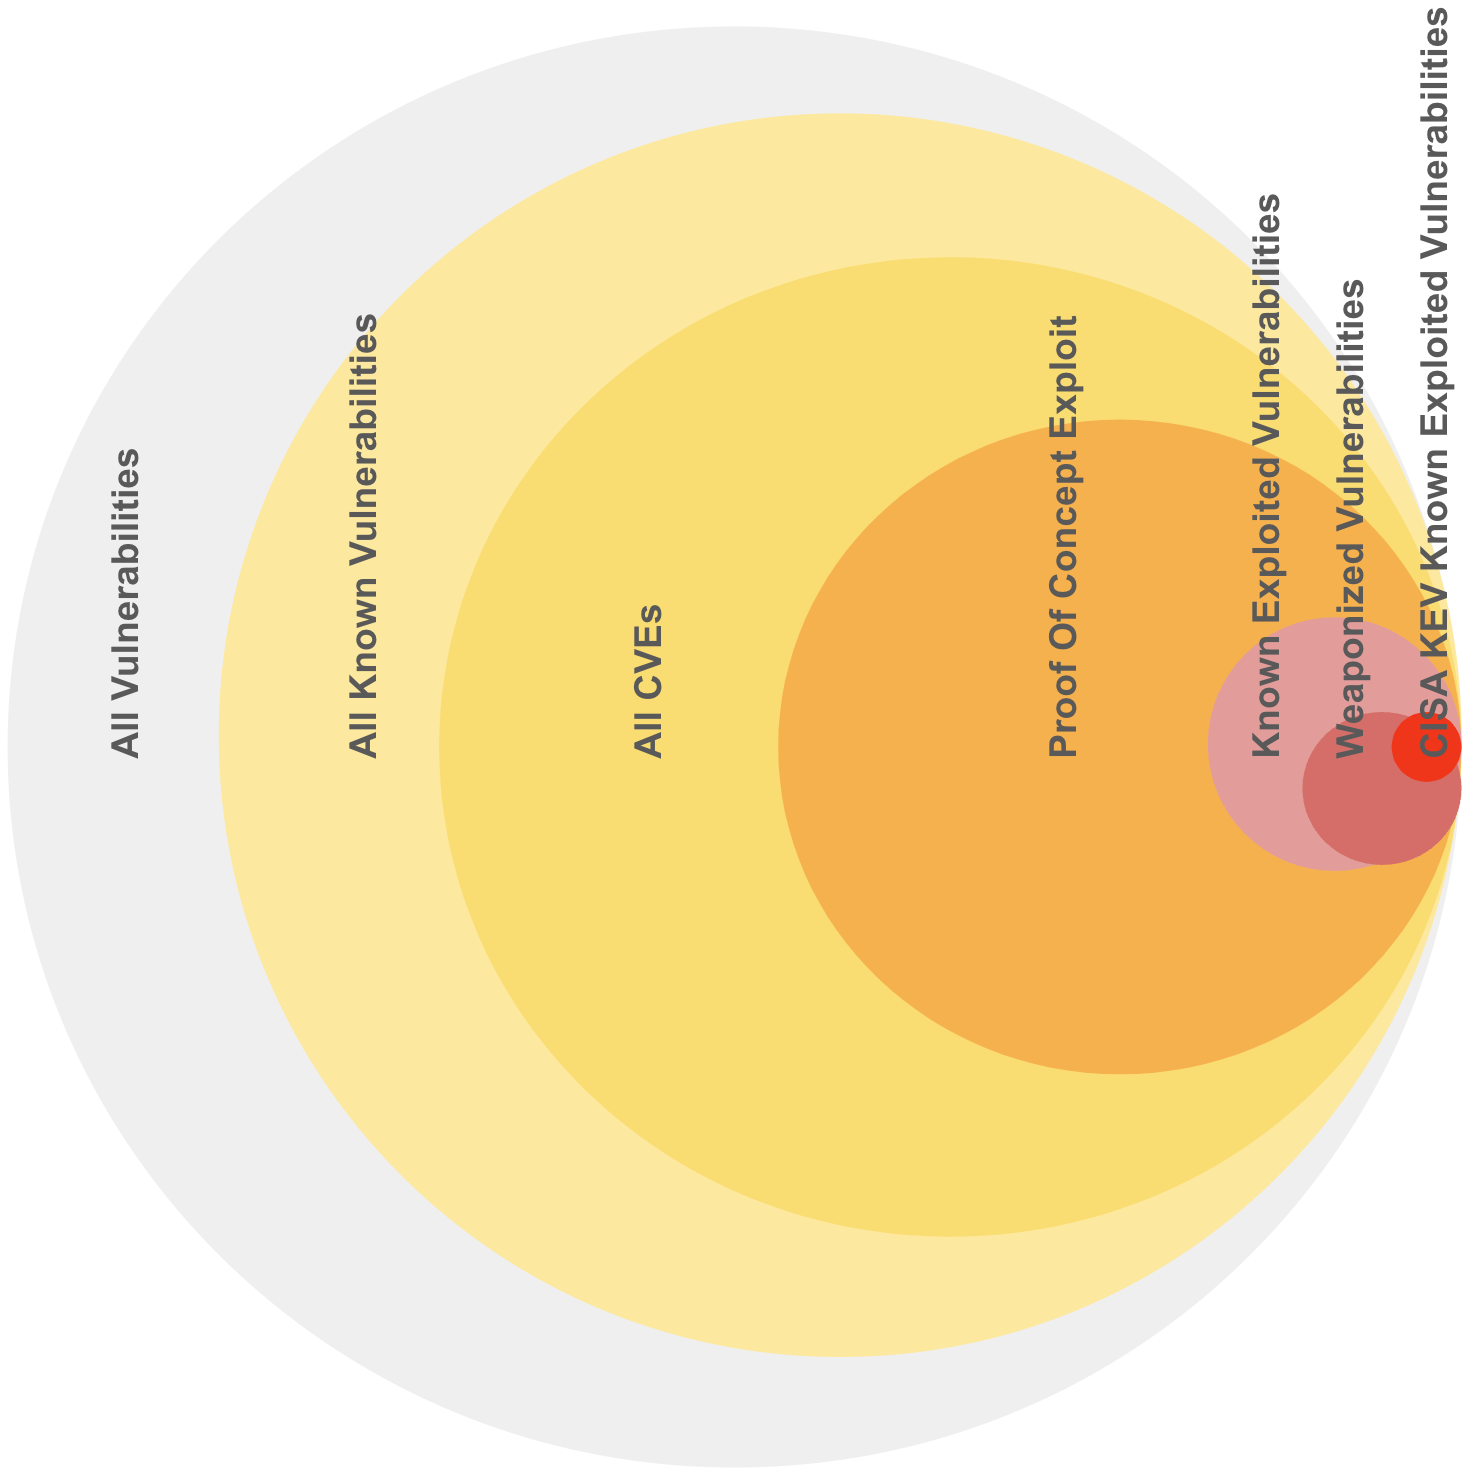
Representative sizes and overlaps shown as there isn't authoritative exact data.
- ~~50% (~~100K) of all CVEs (~200K) have known exploits Proof Of Concepts available (based on a commercial CTI product used by the author)
- ~~5% (~10K) of all CVEs are actively exploited
- There isn't a single complete authoritative source for these CVEs
- ~~0.5% (~1K) of all CVEs (~200K) are in CISA Known Exploited Vulnerability
CVEs represent a subset of all vulnerabilities. Your organization will have a subset of these CVEs
- Not all exploits are public/known.
- Not all public exploits have CVEs.
- A typical enterprise will have a subset of exploits/CVEs: ~~10K order of magnitude unique CVE IDs.
- The counts of these unique CVE IDs may follow a Pareto type distribution i.e. there will be many instances of a small number of CVE IDs.
Quote
We know from executing tens of thousands of pen tests that most exploits don't require a CVE. When we're successful using a CVE, it usually isn't on the KEV list.
Likelihood of Exploitation Data Sources
This table shows the number of CVEs (from all published CVEs) that are listed in that data source:
| Data Source | Detail | ~~ CVE count K |
|---|---|---|
| CISA KEV | Active Exploitation | 1 |
| VulnCheck KEV | Active Exploitation | 2 |
| Metasploit modules | Weaponized Exploit | 3 |
| Nuclei templates | Weaponized Exploit | 2 |
| ExploitDB | Published Exploit Code | 25 |
Note
VulnCheck KEV was launched just before this guide was released. So it has not been included in any analysis for this guide initial release - but will likely be for future releases.
EPSS Scores are available for all published CVEs - and cover the range of Likelihood of Exploitation from 0 to 100%.
a proof of concept code for the exploit, is not a good indication that an exploit will actually show in the wild
The presence of a vulnerability in the EDB, i.e. if there exists a proof of concept code for the exploit, is not a good indication that an exploit will actually show in the wild. A Preliminary Analysis of Vulnerability Scores for Attacks in Wild , 2012, Allodi, Massacci
The population sizes for Likelihood of Exploitation decrease, as Likelihood of Exploitation increases
The population sizes for higher Likelihood of Exploitation (Active ~~5%, Weaponized ~~3%) are relatively small compared to Proof Of Concept (~~50%), and All CVEs (100%).
This table lists the main public data sources.
Other Vulnerability Data Sources
In addition, there are many more Vulnerability Data Sources:
- Open Source vulnerability database
- "This infrastructure serves as an aggregator of vulnerability databases that have adopted the OSV schema, including GitHub Security Advisories, PyPA, RustSec, and Global Security Database, and more."
- Red Hat Security Advisories/RHSB
- Go Vulnerability Database
- Dell Security Advisory
- Qualys Vulnerability database
- Tenable Vulnerability database
- Trickest "Almost every publicly available CVE PoC"
Cyber Threat Intelligence vendors may provide an aggregation of this data.
Takeaways
- There isn't a single complete authoritative source for all CVEs that are actively exploited - so we need to use multiple incomplete imperfect sources.
- The population sizes for higher Likelihood of Exploitation (Active ~~5%, Weaponized ~~3%) are relatively small compared to Proof Of Concept (~~50%), and All CVEs (100%).
- Not all vulnerabilities are public/known, and for those that are known, not all of them have CVEs assigned.
- A typical enterprise will have a subset of exploits/CVEs: ~~10K order of magnitude unique CVE IDs.
- The counts of these unique CVE IDs may follow a Pareto type distribution i.e. for your environment, there will likely be many instances of a small number of CVE IDs.